안녕하세요. 코드장인입니다.
오늘은 삼성증권 배당금 정보를 수집하고 시가배당률 계산법으로 적정 주가를 계산해 보겠습니다.
시가배당률 투자법을 모르신다면 이 글을 꼭 읽어 보세요.
필요한 라이브러리입니다.
주식 데이터는 pykrx api를 사용합니다.
import numpy as np
import pandas as pd
from scipy.signal import savgol_filter
from pykrx import stock
import matplotlib.pyplot as plt
import time
plt.rcParams['font.family'] = 'Malgun Gothic'
10년간 배당금 정보를 읽어 오겠습니다.
"""
분석 기간
"""
start_year = '2012'
end_year = '2021'
"""
삼성증권
"""
code = '016360'
"""
매년 5월 31에 제일 가까운 영업일의 배당금 가져 오기
"""
dps_list = []
for year in range(int(start_year)+1, int(end_year)+2):
#print(year)
last_business_day_of_may = stock.get_nearest_business_day_in_a_week(str(year)+'0531')
print(last_business_day_of_may)
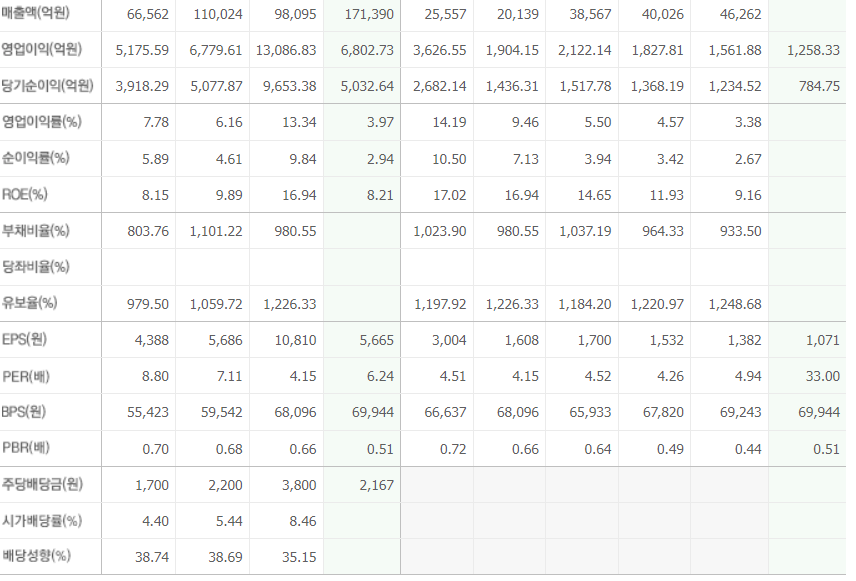
df_annual_f = stock.get_market_fundamental(last_business_day_of_may, last_business_day_of_may, code)
display(df_annual_f)
dps_list.append(df_annual_f.DPS.values[0])
time.sleep(1)
배당금 정보는 dps_list에 저장되어 있습니다.
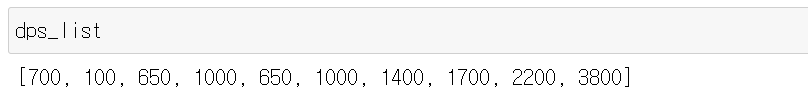
가장 최근인 2021년 배당금은 3800원입니다.
네이버 증권 데이터랑 동일합니다.
2022년 예상 배당금은 2167원으로 배당컷이 거의 확실합니다.
10년 배당금 데이터를 바 그래프로 그려 보겠습니다.
name = stock.get_market_ticker_name(code)

plt.title(f'{name} - 연도별 배당금')
plt.bar(range(int(start_year), int(end_year)+1), dps_list)
plt.show()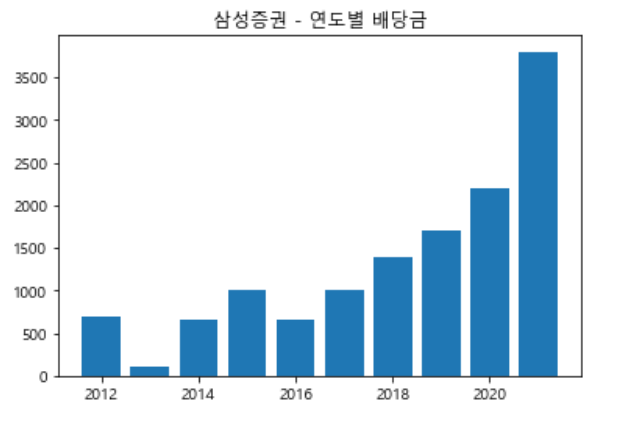
액수도 같이 출력해 보겠습니다.
# function to add value labels
def addlabels(x,y):
    for i in range(len(x)):
        plt.text(x[i], y[i]+5, y[i], ha = 'center')

#name = stock.get_market_ticker_name(code)
plt.title(f'{name} - 연도별 배당금')
plt.bar(range(int(start_year), int(end_year)+1), dps_list)
addlabels(range(int(start_year), int(end_year)+1), dps_list)

#addlabels(years, dps_list)
plt.show()
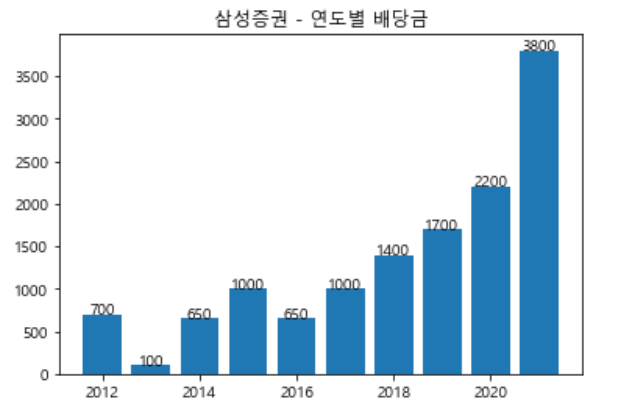
그림만 봐도 배당 성장률이 상당히 높다는 걸 알겠습니다.
CAGR로 계산해 보겠습니다.
배당 성장 년수는 얼마일까요?
def getActualDivGrowth(divs):
    div_history = divs.copy()
    div_history.reverse()
    div_growth_list = []
    for div_cur, div_before in zip(div_history, div_history[1:]):
        print(f'div_cur = {div_cur}, div_before = {div_before}')
        if div_before == 0:
            #print('div_before is 0')
            break;

        if div_cur >= div_before:
            div_growth_list.append(div_cur)
        else:
            #print('div_before is more than div cur')
            div_growth_list.append(div_cur)
            break

    div_growth_list.reverse()
    return len(div_growth_list) - 1, div_growth_list
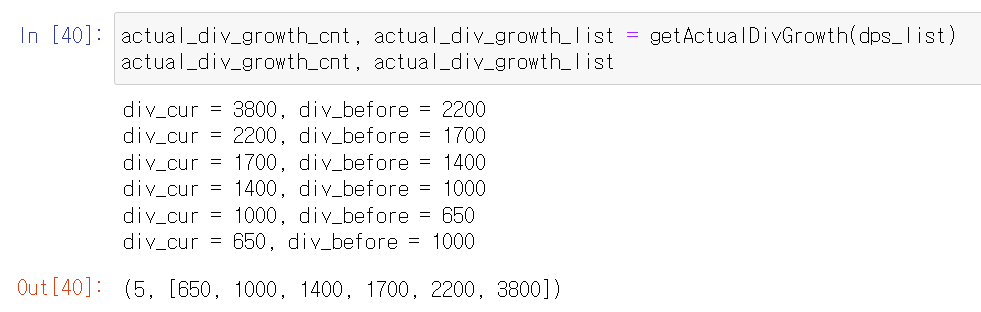
5년 동안 배당을 늘려 왔습니다.
5년 배당 성장률을 계산해 보겠습니다.
def getCAGR(div_history):
    cagr = (div_history[-1]/div_history[0]) ** (1/len(div_history)) - 1
    return cagr


cagr = getCAGR(actual_div_growth_list)
cagr
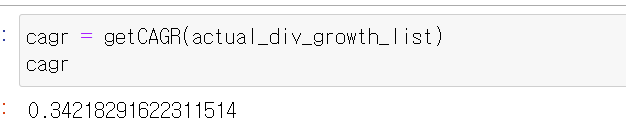
대략 34%입니다. 엄청난 성장률입니다.
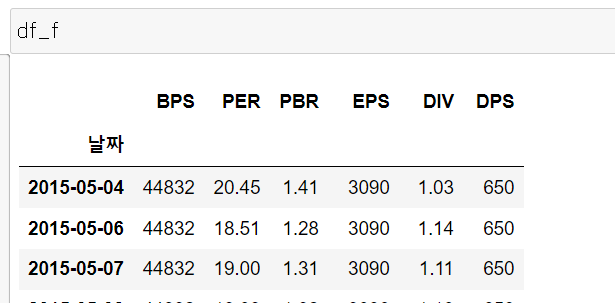
이제 시가배당률 데이터를 이용해서 적정 주가를 계산해 보겠습니다.
시가배당률 데이터를 수집합니다.
start_date = '20150501'
end_date = '20230222'
df_f = stock.get_market_fundamental(start_date, end_date, code, freq='d')
주가 데이터도 수집합니다.
df_p = stock.get_market_ohlcv(start_date, end_date, code)
df_p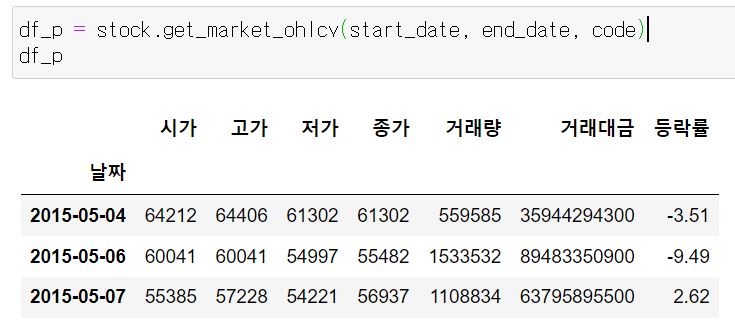
div_yields = savgol_filter(df_f.DIV, 51, 3)
close_prices = savgol_filter(df_p.종가, 51, 3)
"""
주가 배당률 그리기
"""
fig, ax1 = plt.subplots()
color = 'tab:red'
ax1.set_xlabel('year')
ax1.set_ylabel('price', color=color)
ax1.plot(close_prices, color=color)
ax2 = ax1.twinx()
color = 'tab:blue'
ax2.set_ylabel('dividend yield', color=color)
ax2.plot(div_yields, color=color)
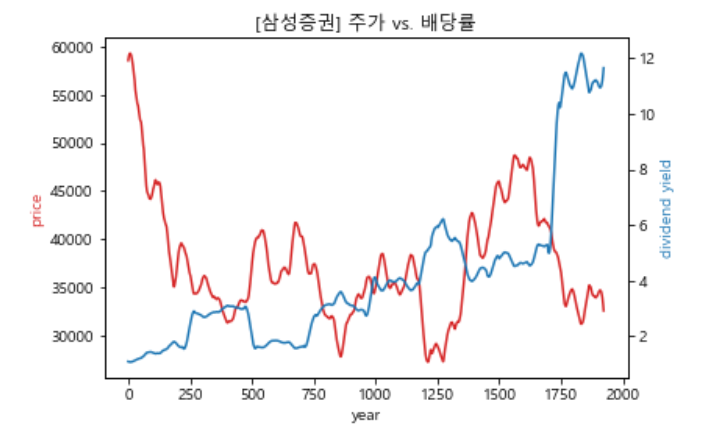
plt.title(f'[{name}] 주가 vs. 배당률')
plt.show()
주가와 배당률 데이터를 그려 보겠습니다.
시가배당률법에 의한 적정 주가 계산 공식입니다.
| (현재 배당금)/(역사적 최저 시가 배당률) * 100 |
3월 8일 배당금을 구합니다.
cur_dps = dps_list[-1]
div_min = min(div_yields)
target_price = cur_dps/div_min * 100
target_price
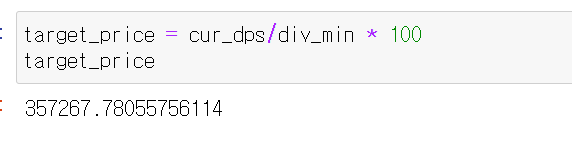
시가배당률법에 의한 적정주가는 대략 35만 원입니다.
마지막으로 역사적 배당률 고점과 저점 그리고 현재 배당률을 그래프로 그려 보겠습니다.
fig, ax1 = plt.subplots()

color = 'tab:red'
ax1.set_xlabel('year')
ax1.set_ylabel('price', color=color)
ax1.plot(close_prices, color=color)

ax2 = ax1.twinx()

color = 'tab:blue'
ax2.set_ylabel('dividend yield', color=color)
ax2.plot(div_yields, color=color)

ax2.axhline(y=div_min, color='y', linestyle='--', label='min div yield')
ax2.axhline(y=div_max, color='r', linestyle='--', label='max div yield')
ax2.axhline(y=div_yields[-1], color='g', linestyle='--', label='current div yield')

plt.legend(loc='upper left', framealpha=1.0)
plt.title(f'[{name}] 주가 vs. 배당률')
plt.show()
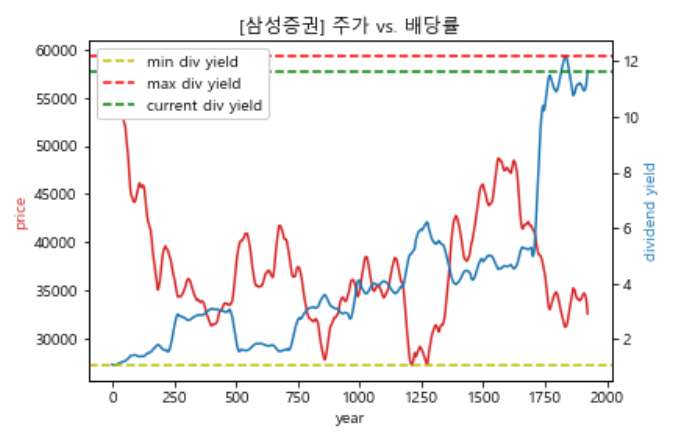
시가배당률이 역사적 고점에 근접했습니다.
시가배당률 투자법에 의하면 매수 적기입니다.
시가배당률 투자법으로 계산한 적정 주가 리스트를 확인해 보세요.
※ 본 글은 특정 종목에 대한 투자 추천이 아니며 모든 투자 책임은 본인에게 있습니다.
감사합니다.
'투자 연구소 > 한국 주식 분석' 카테고리의 다른 글
| 코스닥 저평가 우량 배당주 리스트 - 20240321 (0) | 2024.03.22 |
|---|---|
| TIGER 배당성장 ETF 50 종목 고배당 리스트, 적정 주가, 1위 삼성증권 11.64% (0) | 2023.03.08 |
| [파이썬 퀀트투자] 금호석유 배당금, 배당 성장률, 주가 전망 (0) | 2023.02.23 |
| 삼성전자 적정 주가는 얼마인가? 자기만의 투자 전략을 세우자! (8) | 2021.10.14 |
| 네이버와 카카오의 급락과 주가 분석, 기회인가 위기인가? (2) | 2021.09.17 |